By Richard Schwinn, Research Economist
The Office of Advocacy frequently receives requests for small business statistics. In most cases, the information is already curated in one of the 20-plus publications that Advocacy publishes each year. Occasionally, a request may require digging into federal statistical agencies’ data for analysis.[1] Unfortunately, there are also times when the requested data is unavailable. One such example has been requests for information on small business activity within specific congressional districts.
Previously, the best response to questions about congressional districts was to provide adjoining county or state level statistics. To properly address this topic, Advocacy has been working with the Census Bureau to generate small business statistics for the congressional districts by industry.[2] Last year, Census made this data available in table format.
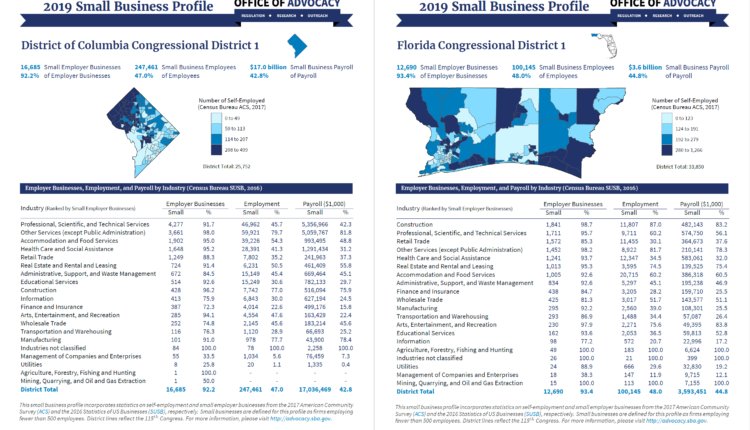
This year, to make the most of the new data for small business stakeholders, Advocacy has launched a new publication, the Congressional District Profiles. The new report includes congressional district maps showing self-employment levels by Census tracts as well as statistics on small business prevalence, employment and payroll by industry. The district profiles are an addition to Advocacy’s small business profile series, which provide user-friendly snapshots of national, state, territory and now congressional-district-level small business statistics.
The 436-page Congressional District Profiles is generated using
open-source software and the techniques of reproducible research. Research is
considered to be reproducible if non-experts can easily recreate the results.
Reproducibility techniques fundamentally lower the cost of generating periodic
reports. The standard word-processor/spreadsheet workflow requires manual
copying and formatting of hundreds of figures and tables for each report.
Instead, by using RStudio, the R development environment for statistical
computing and graphics, and a reproducible framework, one needs only to design
a single profile. Next the data for each district was fed into the document to
create all 436 profiles.[3]
Using this efficient process, Advocacy will be able to easily generate new
editions of the series for future SUSB data releases.
[1] The Office of Advocacy is not a data collection agency, and it relies on federal statistical agencies to produce publicly available data on small businesses. Advocacy uses this data when calculating small business statistics and producing its research on small businesses.
[2] Advocacy provides funding to the Census Bureau to help produce the Statistics of US Businesses, or SUSB. The process of collecting, verifying, compiling survey data causes a two-year lag between the time SUSB’s data is collected and when it is published. Data for 2015 and 2016 are now available, and data for 2017 is expected to be released soon.
[3] While many libraries were used in the development of this project, two were indispensable: tigris, by Kyle Walker, which facilitates access to Census map files, and knitr, by Yihui Xie, which manages report generation.
