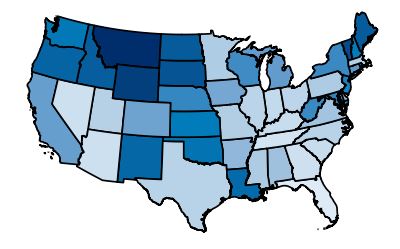
2021 Small Business Profiles For The States, The District of Columbia, and The U.S.
Advocacy’s annual State Profiles provide a snapshot of each state’s small businesses. The profiles gather the latest federal economic data into state-by-state snapshots of small business health and economic activity.
This year’s profiles focus on state small business dynamics and employment. They answer questions like:
- How many small businesses are in my state?
- How many people do small businesses employ?
- How many jobs do they create?
- How many establishments opened and closed?
- What industries have the most small businesses?
- What demographic groups own the most small businesses?
- How much do small businesses export?
Traditional small business datasets still predate the effects of the COVID-19 pandemic. For more information on how COVID-19 has impacted small businesses, see here.
The files below contain the 50 individual state profiles, plus profiles for the United States and District of Columbia. Small business profiles of the U.S. Territories and Congressional Districts will be released later this year.
2021 Small Business Profiles for the Territories
Notes on the data and methodology used are available here.
*2021 Territory profiles were added December 28, 2021. Original post went online on August 30, 2021.


Comments are closed.